Vega.jl
A Julia package for generating visualizations in Vega
Getting Started
Visualization Primitives
Creating A Visualization From Scratch
Pre-defined Visualizations
Area PlotAster Plot
Bar Plot
Box Plot
Bubble Chart
Choropleth
Dot Plot
Grouped Bar
Heatmap
Horizon
Histogram
Joint Plot
Line Plot
Pie/Donut Chart
Population Chart
Punchcard
Ribbon Plot
Rug Plot
Scatter Plot
Stem-and-Leaf Plot
Stream Plot
Waterfall
Word Cloud
Interactive Visualization
Interact.jl and Vega in Jupyter NotebooksCreating Interactive Sites Using Escher and Vega
Visualization Mutating Functions
colorscheme!General Visualization Properties
hline! / vline!
hover!
jitter!
legend!
stroke!
text!
title!
xlab! / ylab!
xlim! / ylim!
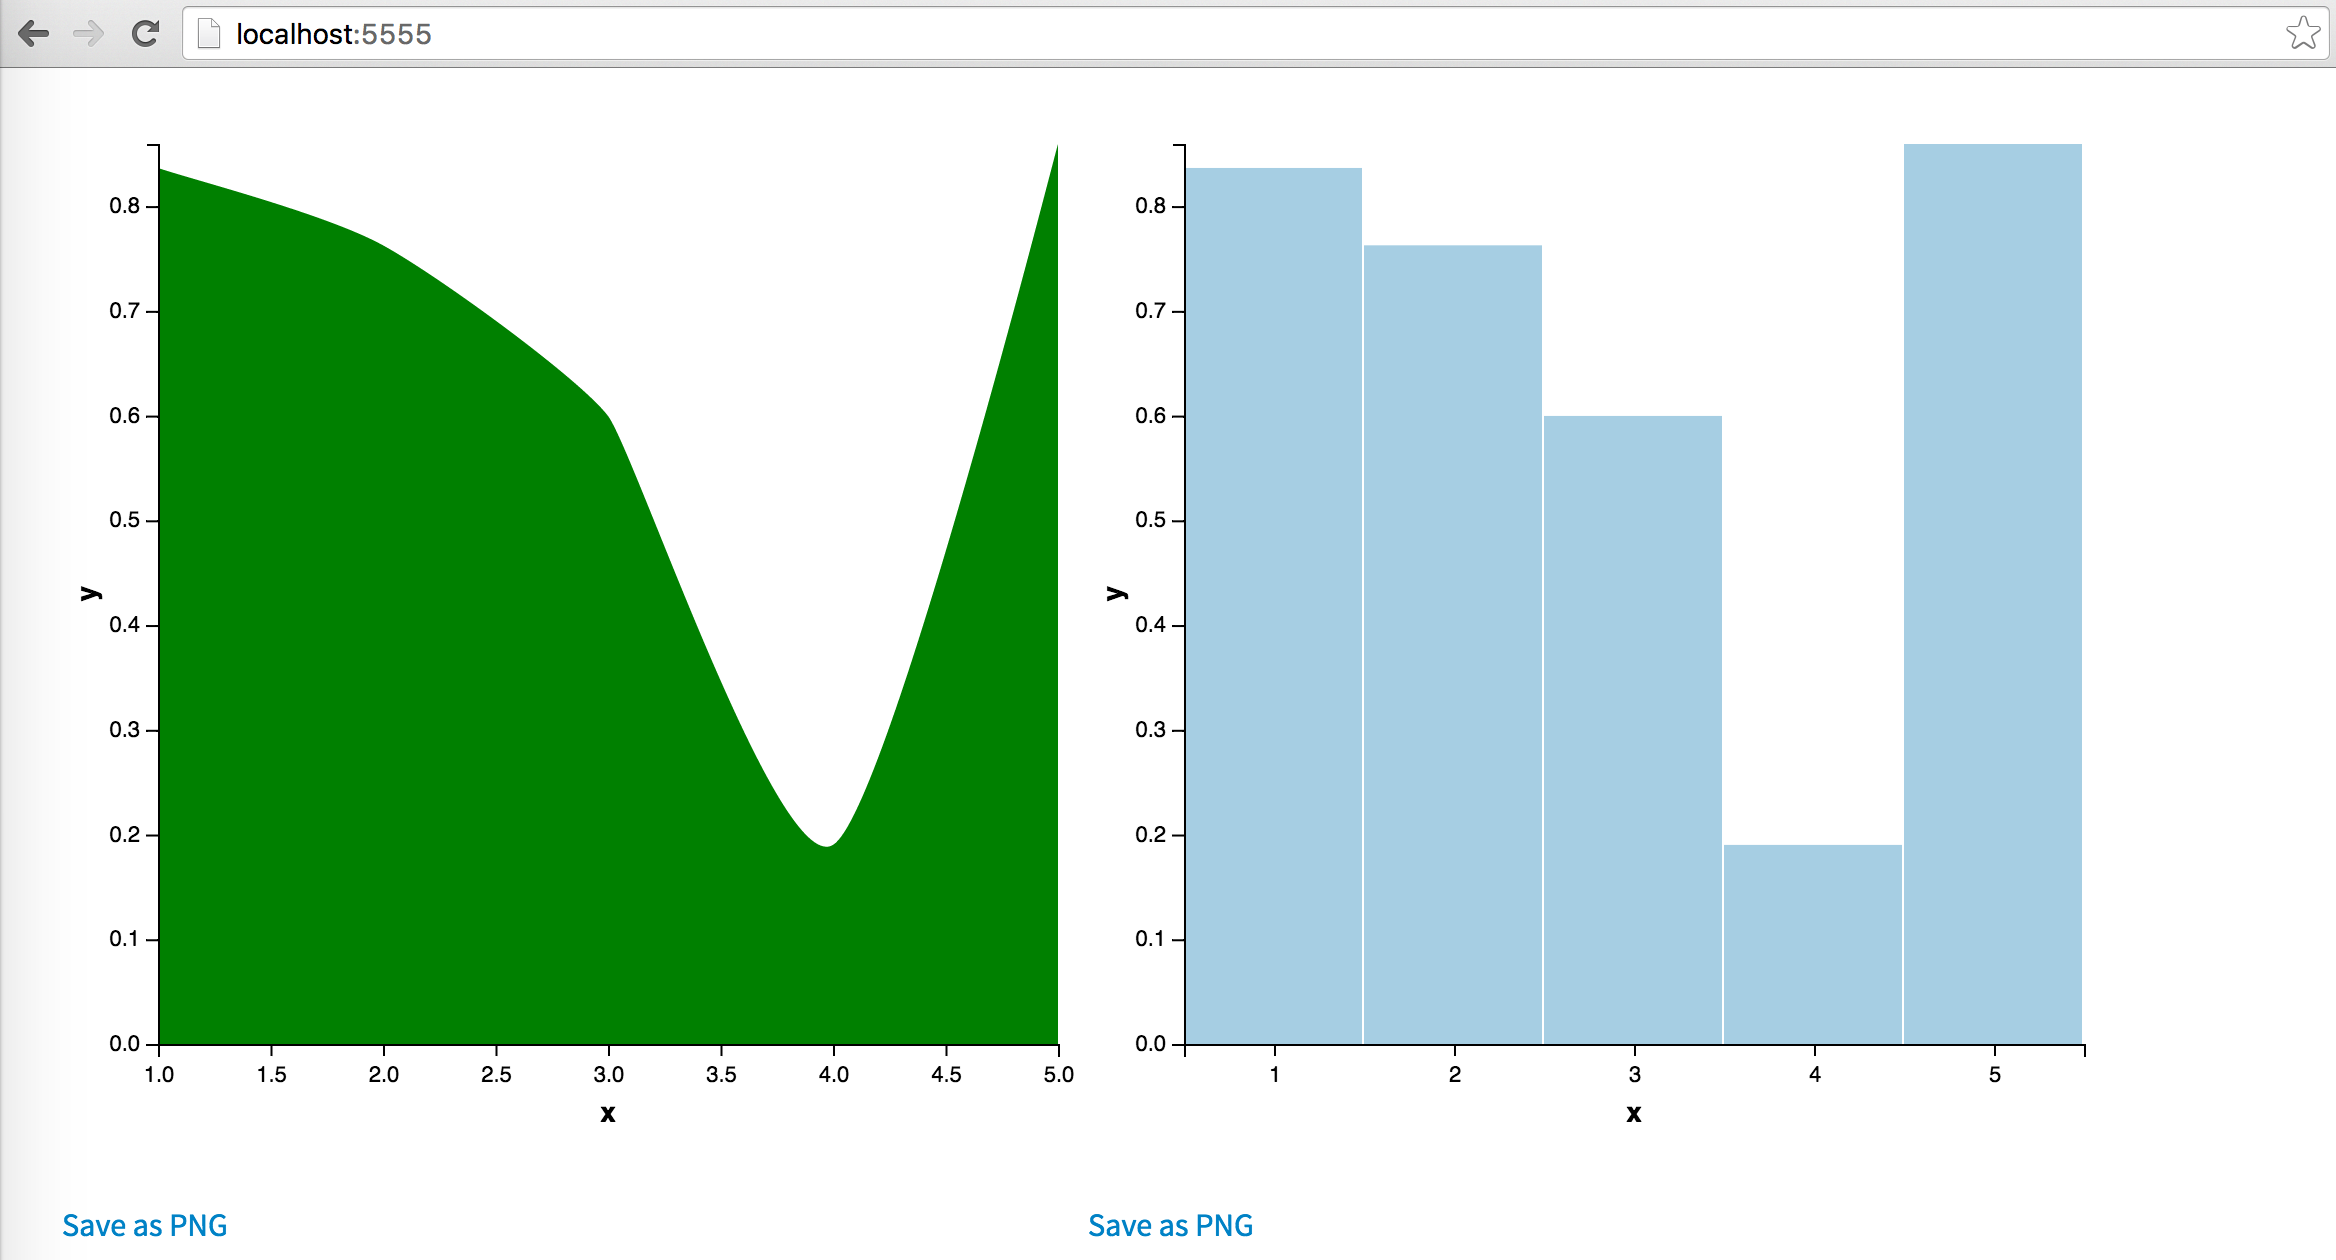
Creating Interactive Sites Using Escher and Vega
Vega.jl provides support automatically for Escher.jl web UIs through an “optional dependency”. While not installed as part of the Vega REQUIRES file, if a user has Escher installed in their Julia packages (using Pkg.add("Escher")), Vega will include functionality for automatically converting the ::VegaVisualization type to Escher ::Tile.
Besides a using Vega statement, the only other line of code needed to render a Vega chart within Escher is push!(window.assets,("Vega","vega-plot")). This includes the Vega JavaScript libraries in Escher; after that, you can place your normal Vega.jl code within the main() function in Escher and your charts will render.
using Vega
function main(window)
    push!(window.assets,("Vega","vega-plot"))

    x = 1:5
    y = rand(5)

    a = areaplot(x = x, y = y)
    colorscheme!(a, palette = "green")
    b = barplot(x = x, y = y)

    hbox(a, b) |> pad(2em)

end